

Tools
As single-cell and spatial technologies continue to advance, an increasing number of analysis tools become available to researchers. Consequently, there is a growing need for datasets and methods that support systematic benchmarking and evaluation of these tools. Validating and benchmarking analysis tools for single-cell measurements has been listed as one of the “Eleven grand challenges in single-cell data science” by Lähnemann et al. (2020).
The ELIXIR Single-Cell Omics Community facilitates benchmarks, sets standards of evaluation, and engages with the community to benchmark particular tasks. For example, we organized SpaceHack 2.0 which included the following focus areas, among others:
This page provides a brief introduction to benchmarking infrastructures and datasets. You can find a list of some analysis tools for single-cell and spatial data here.
Omnibenchmark provides community-driven, extensible and continuously-updating benchmarks. Omnibenchmark defines, runs and versions benchmark execution pipelines by leveraging a formal benchmark specification and a set of (reusable) benchmarking modules. Each benchmarking module implements a data processing step (typically a preprocessing step, method, or metric) and is stored as an independent git repository. Anyone can start (or contribute to) a benchmark. A contribution can be a relevant ground truth dataset, a missing method or metric, or update to existing modules. Omnibenchmark relies on widely used, free and open software solutions, including: git (version control system), GitLab (DevOps), Snakemake (workflow management system), easybuild (reproducible software environments), and apptainer (containerization), among others.
OpenEBench is the ELIXIR benchmarking and technical monitoring platform for bioinformatics tools, web servers and workflows.
DANCE is the first standard, generic, and extensible benchmark platform for accessing and evaluating computational methods across the spectrum of benchmark datasets for numerous single-cell analysis tasks. Currently, DANCE supports 3 modules and 8 popular tasks with 32 state-of-art methods on 21 benchmark datasets. People can easily reproduce the results of supported algorithms across major benchmark datasets via minimal efforts, such as using only one command line. In addition, DANCE provides an ecosystem of deep learning architectures and tools for researchers to facilitate their own model development. DANCE is an open-source Python package that welcomes all kinds of contributions. OmicsML/dance GitHub.
Integrated Benchmarking scRNA-seq Analytical Pipeline (IBRAP) contains a suite of analytical components that can be interchanged throughout the pipeline alongside multiple benchmarking metrics that enable users to compare results and determine the optimal pipeline combinations for their data.
Benchmarking data can be created in wet lab or in silico by simulators. In this section we present some wet lab experiments and introduce some simulators.
Despite the fact that simulators have several limitations, there has been a significant effort in the past few years to enhance their power, as noted by Cao et al. (2021). The scDesign3 Song et al. (2024) is a versatile tool simulating single cell and spatial transcriptomics data. GRouNdGAN, GRN-guided in silico simulation of single-cell RNA-seq data using causal generative adversarial networks, is a causal implicit generative model for reference-based GRN-guided simulation of scRNA-seq [Zinati et al. 2024]. scReadSim is a single-cell RNA-seq and ATAC-seq read simulator Yan et al. 2023
Over the past few years, there has been a significant increase in the number of published single-cell omics studies, which serve as valuable resources for benchmark experiments. In particular, Svensson et al. (2020) have compiled a comprehensive collection of single-cell omics datasets with manually curated metadata. As part of the Implementation study SCONE of the ELIXIR Single-Cell Omics Community, we created a series of datasets specifically designed for benchmarking computational tools that focus on single-cell tumor heterogeneity.
The Arc Virtual Cell Atlas is a collection of high quality, curated, open datasets assembled for the purpose of accelerating the creation of virtual cell models. The atlas includes both observational and perturbational data from over 330 million cells (and growing). Arc scientists developed AI agents to automatically identify and curate single-cell datasets from public repositories, processing them through a standardized pipeline that ensures consistency across different experimental sources. This uniform approach enables better integration between different types of single-cell data and provides researchers with a dataset optimized and tailored for virtual cell model pretraining.
HubMAP created an open, global atlas of the human body at the cellular level. The focus of HuBMAP is understanding the intrinsic intra-, inter-, and extra- cellular biomolecular distribution in human tissue. HuBMAP will focus on fresh, fixed, or frozen healthy human tissue using in situ and dissociative techniques that have high-spatial resolution.
Distinct cancer cells exhibit diverse morphological and phenotypic profiles, including gene expression, metabolism, and proliferation. This tumor heterogeneity poses challenges for molecular prognostic markers and patient classification for targeted therapies. Various omics technologies, such as bulk [Babu & Snyder (2023)] and single-cell omics [Flynn et al. (2023)] approaches, have enabled the characterization of diverse molecular layers at an unprecedented scale and resolution, offering a comprehensive perspective on the behavior of tumors. The integration of multiple omics datasets enables systematic exploration of diverse molecular information [Yue et al. (2023)] at each biological layer, but also presents challenges in extracting meaningful insights from the exponentially growing volume of multi-omics data. To address this challenge, efficient algorithms are required to dig into the data and reveal the underlying complexities of cancer’s intricate biological processes.
CELLxGENE is a suite of tools that help scientists to find, download, explore, analyze, annotate, and publish single-cell datasets. It allows users to download a wide set of published single-cell experiments as h5 or seurat (v3) format.
CellCommuNet is an atlas of cell–cell communication networks from single-cell RNA sequencing data of human and mouse tissues in normal and disease states [Ma et al. NAR 2024].
IMMUcan scDB is a fully integrated scRNA-seq database exclusively dedicated to human cancer. IMMUcan scDB encompasses 144 datasets on 56 different cancer types, annotated in 50 fields containing precise clinical, technological, and biological information [Camps et al. Cancer Res. 2023].
TISCH2 is s a scRNA-seq database focusing on tumor microenvironment (TME). TISCH2 provides detailed cell-type annotation at the single-cell level, enabling the exploration of TME across different cancer types.
DISCO stores a manually curated selection of publicly available datasets, comprising more than 9000 samples, within the repository. These samples are pre-processed by re-aligning to a single reference genome and undergo a rigorous cell level quality control (QC) pipeline, which filters out samples based on mitochondrial mRNA counts, unique feature counts, and cell numbers using an automated algorithm. It also provides manual metadata curation, harmonizing the metadata across datasets.
PanglaoDB is a database for the scientific community interested in exploration of single cell RNA sequencing experiments from mouse and human. It integrates data from multiple studies and present them through a unified framework.
SPICA is the Swiss Portal for Immune Cell Analysis.
Broad Single Cell Portal Broad institute single cell portal.
‘Pseudo cells’ were created from to five distinct human lung adenocarcinoma cell lines by Tian et al 2019. GEO dataset GSM3618014] contains the mixture of five cell lines:
Data were generated using 10XGenomics v2 chemistry. The raw count table was provided without the association of the cell lines to each cell. We have assigned the cell line name to each cell via the similarity between single-cell clusters and cell lines bulk data from CCLE database. The annotated count table and the full procedure used for the annotation are present a figshare dataset [doi.org/10.6084/m9.figshare.23274413.v1]
In NCBI’s GEO repository are available single-cell data on PC9 untreated lung cancer cell line done in two different labs, using both 10XGenomics and Drop-seq platforms and produced from in vitro culture or xenograph experiments.
These datasets, because of their differences, i.e. platforms, growth, labs, represent an ideal instrument to benchmark batch removal methods as well as integration methods. The seven sets are available as datasets with the same gene annotation (ensemblID:Symbol). Each set has the cellID with the extension _s(1:5) and set6 has two extensions _s6PC9 and _s6U937. These datasets and the script used for annotation are available as figshare repository (10.6084/m9.figshare.23626407).
Gavish and collaborators [Nature 2023] have curated, annotated and integrated the data from 77 different single-cell transcriptomics studies encompassing a total of 1163 tumour samples covering 24 tumour types and more than 23 million cells. The data are accessible at 3CA site.
As part of the Single-Cell Omics Community’s Implementation study SCONE we are focusing in providing a set of benchmark experiments to address the extraction of biological knowledge from “controlled” cancer heterogeneity.
This scRNA-seq experiment embedding “controlled” cancer heterogeneity includes the following elements:
The full experiment description is available in the paper by Arigoni et al 2024.
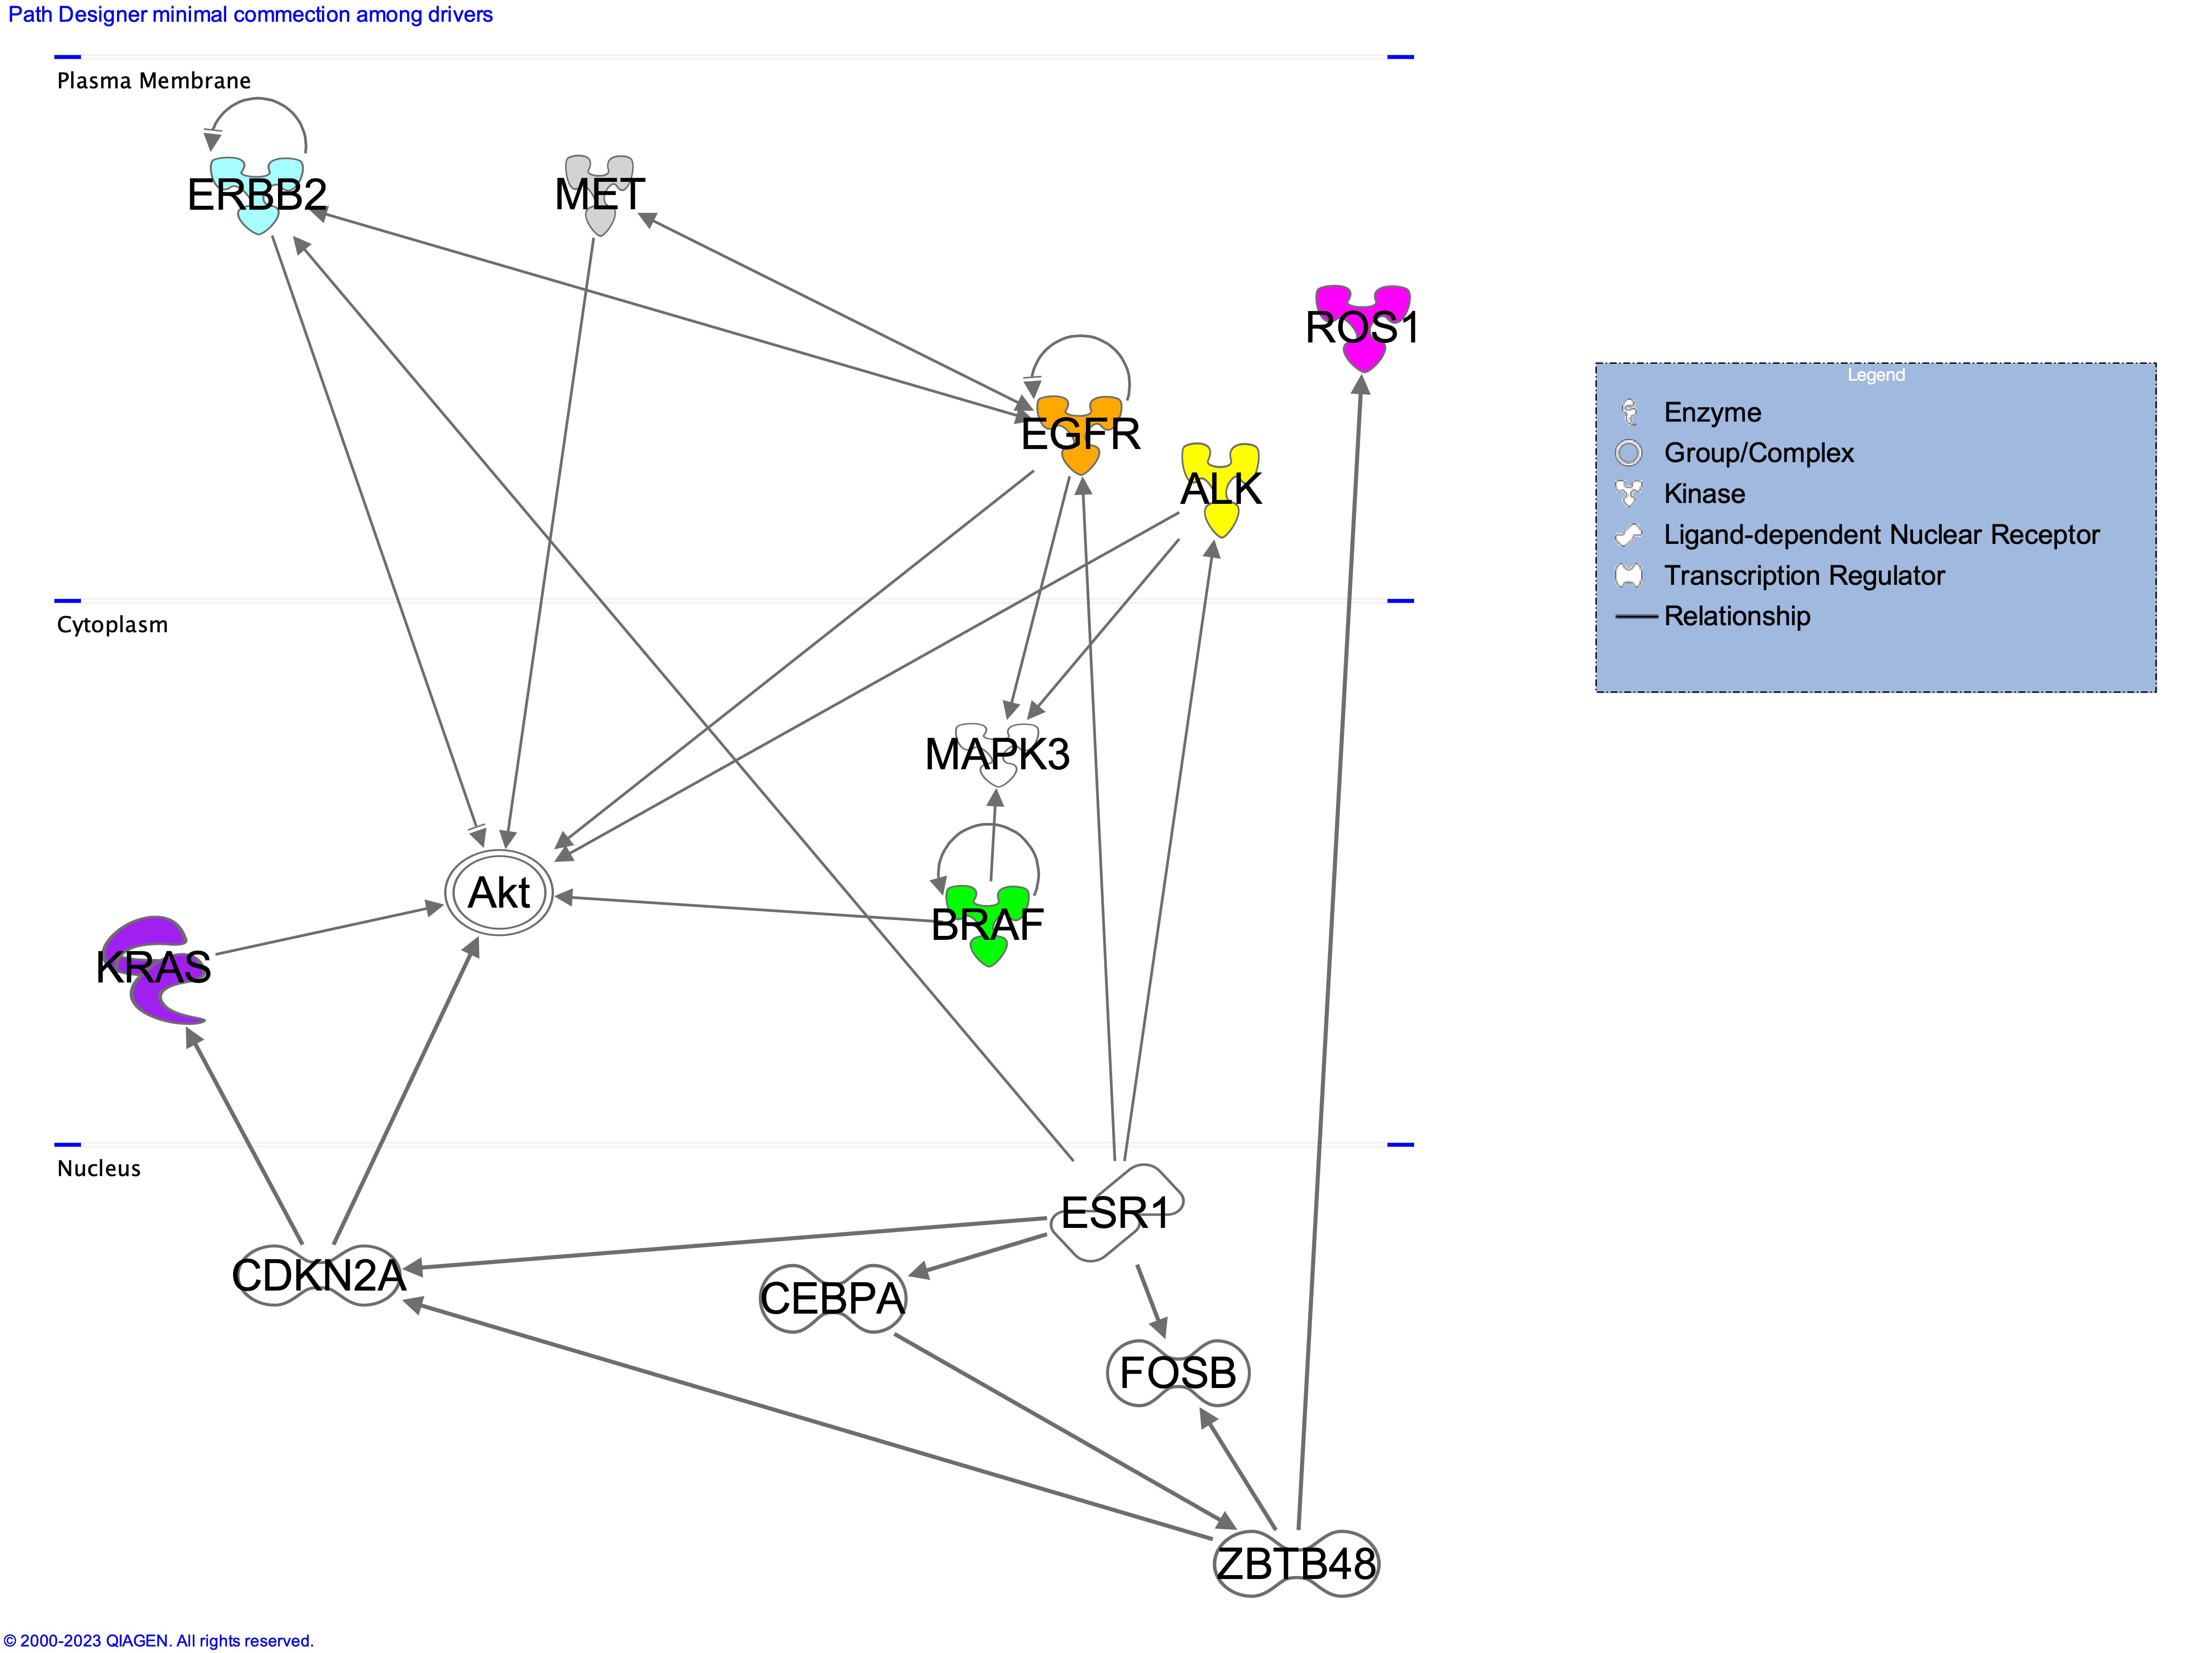
The above figure describes the driver genes associated to each cell line. Only a minimal part of the connections has been shown to easy readability of the image. Full list of the interactions depicted by IPA are available at figshare [10.6084/m9.figshare.23284748]. All driver genes have been observed in resistence occuring upon treatment with Isomertinib of EGFR mutated lung cancers [Gomatou et al. (2023)].
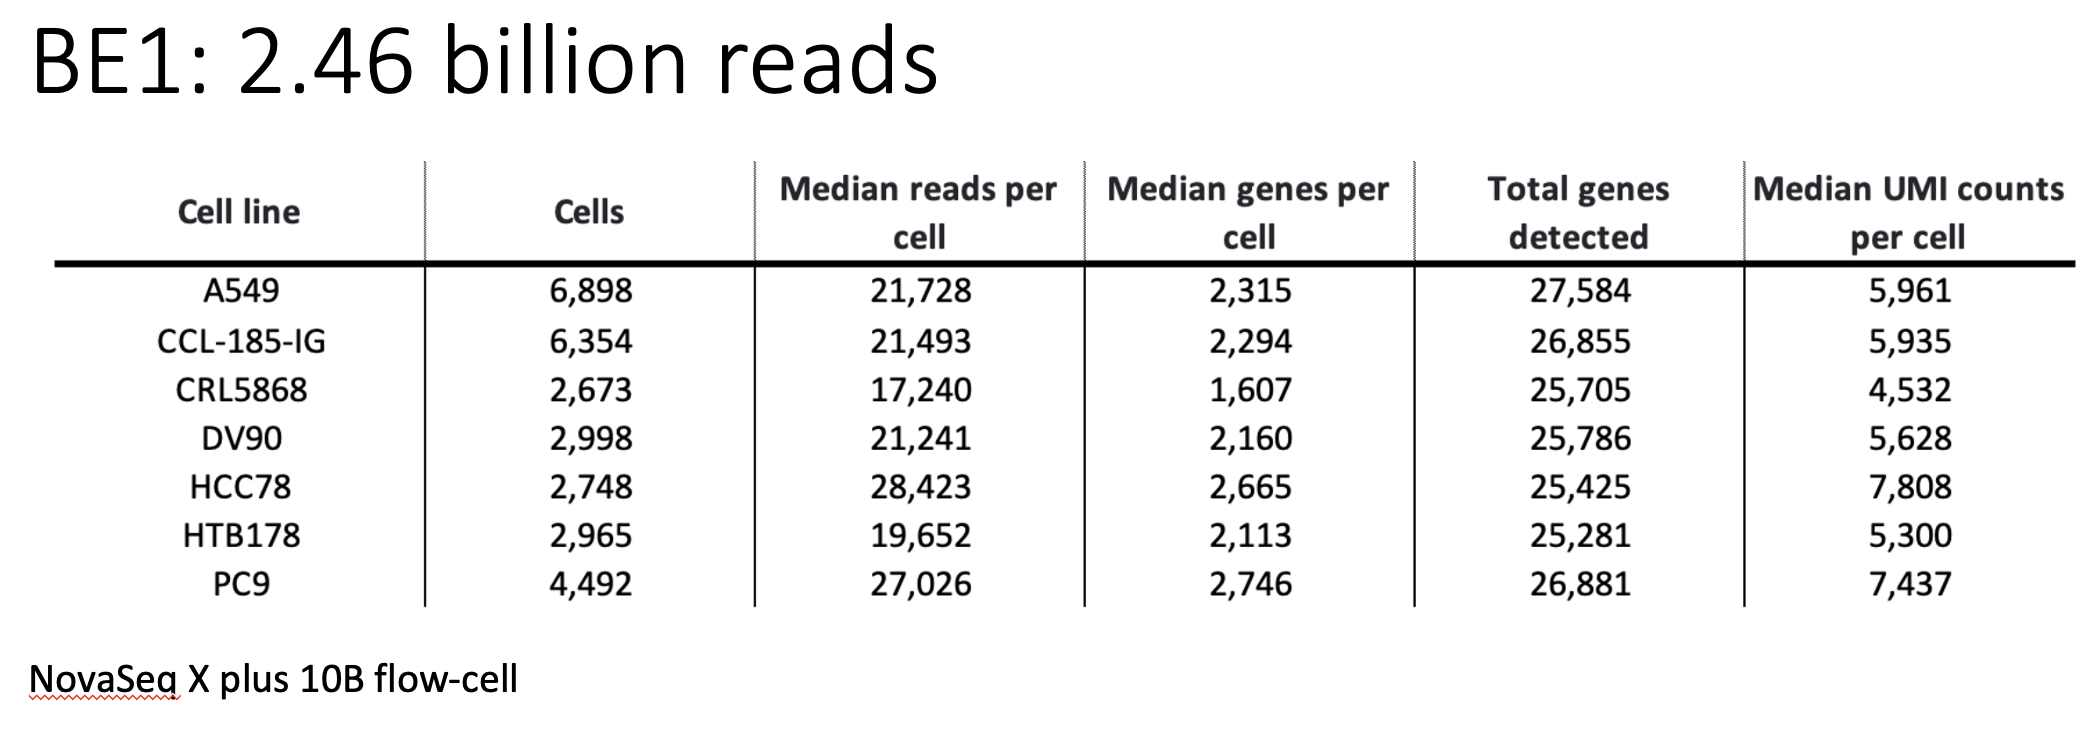 The above figure shows the sequencing statistics of the 7 cell lines.
PC9 and DV90 cell lines were used to generate a comprehesive dataset to benchmark tools for the prediction of cell-to-cell crosstalk (Xie et al. 2023, Zhang et al. 2023). Specifically we will generate three experiments:
All three experiments were analysed in triplicates for secreted microvesicles (RNA/miRNAseq) and bulk intracellular RNA/miRNAseq. At single cell level we performed one experiment for each of the above conditions using the multiomics platform from 10Xgenomics (scnRNAseq and scATAC), the scRNAseq (Illumina platform) and only for the PC9/DV90 co-culture we also simulated a pseudo-tissue and we performed on it a scRNAseq spatial analysis (Curio Bioscience platform). Expected data availability: All data are now available, publication is in preparation.
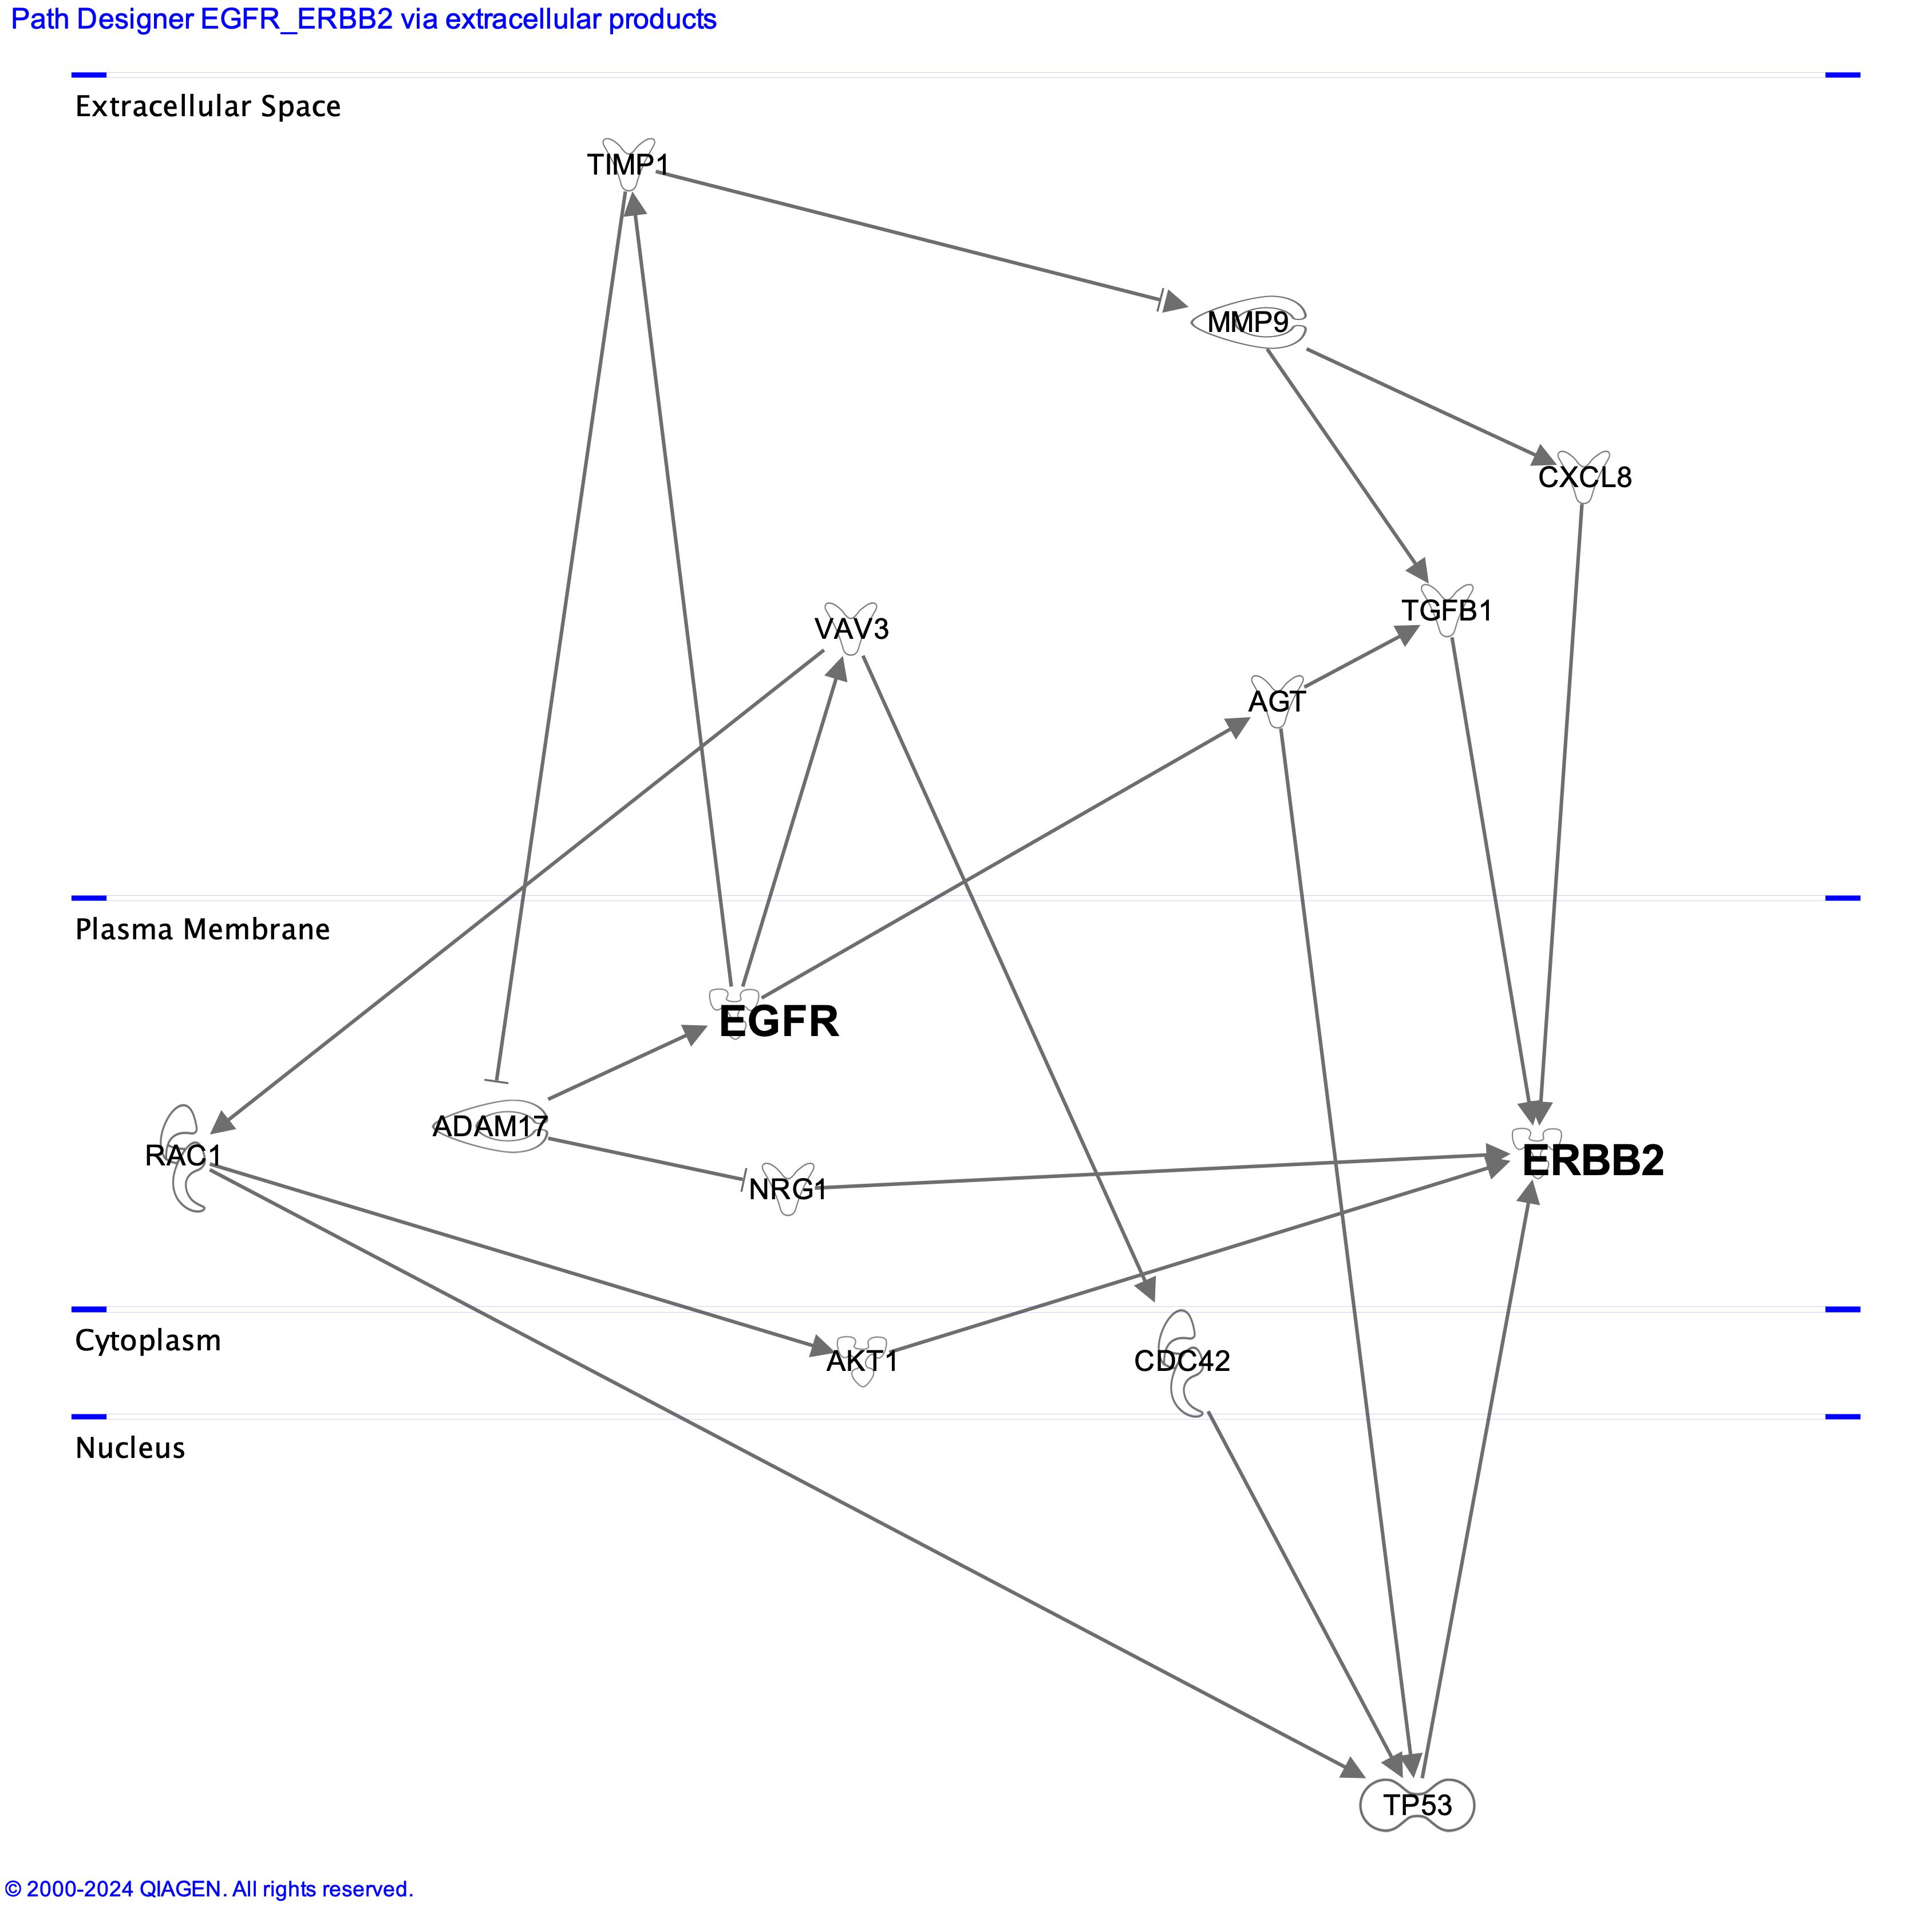 In the above picture, the potential cross talk between PC9 and DV90 driver genes, mediated by soluble molecules, are shown. Data were generated using Ingenuity pathways analysis tool (Qiagen).
Spatial Omics DataBase (SODB) is a comprehensive database designated for general spatial omics data. SODB provides: Various spatial omics data modalities, including spatially resolved transcriptomics, proteomics, metabolomics, genomics and multi-omics.
Spatial Transcript Omics DataBase (STOmics DB) is a comprehensive repository of literature and Datasets related to spatial transcriptomics topics, and provides convenient tools for Data analysis, search and visualization (Xu et al. NAR 2023).
CROST offers single-sample analysis, interactive visualization, multi-omics integration for exploring cancer svg, and other powerful tools for spatial transcriptomics researches (Wang et al. NAR 2023).
SpatialDB is a public database that specifically curates spatially resolved transcriptomic data from published papers, aiming to provide a comprehensive and accurate resource of spatial gene expression profiles in tissues.
SOAR is a comprehensive database of 304 spatial transcriptomics datasets from 11 species across 40 tissue types.
This dataset explores tissue heterogeneity in large, FFPE human breast cancer sections, integrating spatial analysis and single cell RNAseq, (Janesick et al Nat. Comm. 2023). Raw data are available at GEO repository GSE243280.
A curated review of literature on spatial transcriptomics dating back to 1987 [Lambda Moses & Lior Pachter Nature Meth. 2022]